Warning: include(/data/htdocs/hebergementweb/sites/imagemed.univ-rennes1.fr/en/nav.html): failed to open stream: No such file or directory in /data/htdocs/hebergementweb/sites/imagemed.univ-rennes1.fr/template.php on line 144
Warning: include(): Failed opening '/data/htdocs/hebergementweb/sites/imagemed.univ-rennes1.fr/en/nav.html' for inclusion (include_path='.:/usr/share/pear:/data/htdocs/hebergementweb/php-include') in /data/htdocs/hebergementweb/sites/imagemed.univ-rennes1.fr/template.php on line 144
MRQuantif 'Viewer': select and place the ROIs
This screen displays a stack of images for each series selected and opened by the Open selected images button at the bottom of the DICOM browser screen. In the left-hand panel we find the information about the patient and the study, the circular (or oval) ROIs that we want to place with a simple click on one of the images and information about the current ROI.
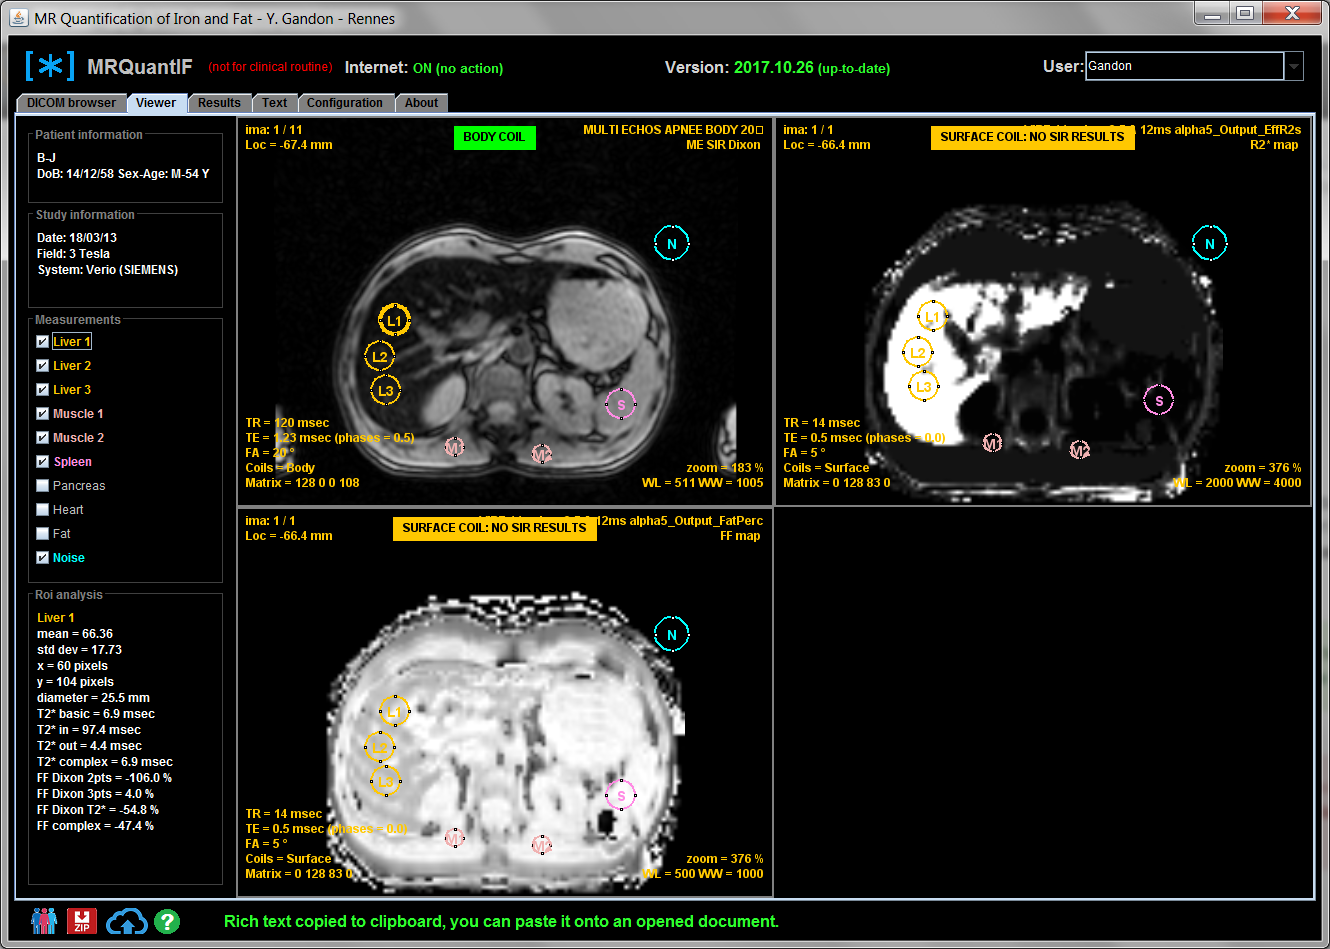
The grid of images
This area displays one quadrant per selected series.
In the corners of the image we find useful information:
- top left: ima: followed by the number of the image and the number of images in the stack and below loc: the height in mm in the z plane
- at the top right: the description of the series and below the details about the recognition of the series (see section Browser)
- bottom left: from top to bottom TR: followed by the repetition time in ms, TE: followed by the echo time in ms, FA: followed by the flip angle in °, Coils: followed by the coil used to receive the signal, Matrix: followed by the matrix used
- bottom right: the zoom in% and below the window settings WL and WW.
The zoom of each image may be different because the software automatically corrects the pixel size to be the same for all series. For the moment there is no automatic registration in x, y but we will see that we can move all the ROIs of a single quadrant en bloc.
At the top of each quadrant, the software displays information about the type of coil used to receive the signal.

For each quadrant we can modify:
- the image of the stack (thus the echo at the same height) via the left mouse button,
- the window (WL and WW) via the right mouse button.
If the import directory of PACS is empty, the software will propose to use the example provided. Otherwise the default directory that is listed in the input field is the last one used.
Right Banner
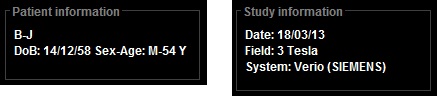
Patient and study Area
This area displays information about the selected patient Patient information and the current Study information.
ROIs Area
We can select the ROIs we want to use. By default the software selects 3 liver ROIs, 2 paravertebral muscles, one for the spleen, one for the background noise. It is inadvisable to reduce this selection unless the spleen is not visible in the image (but it is advisable to choose an image showing the spleen). However, you can increase this selection.
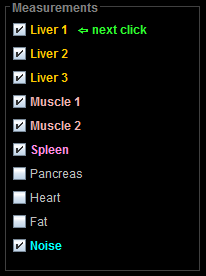
An indicator tells you what will be the next ROI created by clicking on the image. Indeed, a circular ROI of predefined size is created with its center at the place of the click. If there are multiple quadrants, the same ROI is duplicated on the other quadrants. You can change the size of an ROI by clicking on one of the device markers and dragging. To move a created ROI, you have to click on its center and move it by drag and drop. By default all identical ROIs in each quadrant are synchronized.
ROI analysis area
When the cursor is on an ROI it is activated and the measures related to this ROI are displayed in this zone:
 The content may differ depending on the type of image. If one is on a multi-echo series one can have the average signal, the T2 *, the FF ... If one is on a map image (map T2 *, R2 * or FF) the average value will be that of the map.